
OnlyFans pricing changes happen without notice, and external ranking sites track them so subscribers can see how stable a page really is. This guide explains the pricing stability metrics you find on those rankings, what each indicator means, and how to use historical price data to keep monthly spending predictable.
A page sitting at $12.99 that has held that figure for a year is far easier to budget around than a page at $6.99 that has moved four times in six months. Ranking methodology such as the one published by BestOnlyFans treats change frequency, not the price level itself, as the primary stability signal.
Why Price Stability Matters for Monthly Budgeting
OnlyFans bills subscriptions on a recurring basis, and when a creator raises the base price, auto-renew stops. Existing access continues until the paid period ends, but the subscription does not roll over at the old rate. Every price change therefore forces a fresh decision: pay the new amount, or let the subscription lapse.
A single increase is manageable. Three increases in the same month across three different pages can push a planned spend well past what was intended. Ranking sites exist partly because OnlyFans has no built-in discovery feed or directory, so third-party data is the only practical way to compare pages side by side.
The cascade runs further than the first renewal:
- Auto-renewal cancels automatically, so the subscription silently drops out of your billing cycle.
- You receive no new content from that page until you make a manual decision.
- The decision arrives without preparation, often mid-month when discretionary funds are already allocated.
- A rushed re-subscription at the higher price can displace another planned subscription.
- Repeated interruptions train subscribers to abandon annual-style planning entirely, which raises total spend over time.
- Impulse re-subscription at a new tier often adds pay-per-view unlocks and tips you had not budgeted for either.
The point is that volatility carries a real cost on the subscriber side, and stability metrics make that cost visible before you commit.
How Ranking Sites Track Historical Price Data
Ranking sites assemble price history themselves, usually by combining several collection methods and accepting that no single one is complete.
| Tracking Method | Data Source | Update Frequency | Limitation |
|---|---|---|---|
| API polling | Public profile pricing field | Daily to hourly | Captures the current figure only; changes between polls stay invisible |
| Manual submission | Subscriber screenshots and reports | Irregular | Depends on user effort; gaps appear when nobody watches a page |
| Crowdsourced reporting | Community forms on ranking platforms | Continuous but uneven | Occasional errors and duplicate entries need moderation |
| Screenshot analysis | Archived checkout and profile images | Retroactive | Timestamps can be missing, so exact change dates stay approximate |
A site polling daily will catch a price move within a day, while a site relying on reports may only notice it months later. Rankings that display changes in the last 90 days are therefore describing what their collection pipeline observed, not necessarily everything that happened.
Practical tip: before trusting a volatility score, look for a stated methodology or a last-verified timestamp. A score without either is an opinion, not a measurement.
Reading Price Volatility Indicators on Ranking Cards
Most platforms settle on a handful of repeated visual cues, and once you know them you can scan a list of pages in under a minute.
- Stability score: a number from 1 to 10, or a percentage, summarizing how little the price has moved.
- Change count badge: a plain integer showing how many adjustments fall inside the tracked window.
- Trend arrow: up, down, or flat, indicating the direction of the most recent move.
- Colour coding: green for stable, amber for one recent change, red for frequent movement.
- Volatility index: a decimal figure comparing movement size against elapsed time.
- Last-changed date: the single most useful field, because it anchors everything else.
- Days-at-current-price: how long the page has held its present figure.
- Price range bar: the lowest and highest observed base prices on one line.
- Promotional flag: a marker distinguishing a temporary offer from a permanent change.
Read the last-changed date first. A page with six historical changes but none in the past year is behaving differently from one with two changes in the past quarter.
Distinguishing Promotional Changes From Base Price Moves
Promotions and base moves look similar on a chart but behave very differently in your billing cycle.
Ranking data alone is often enough to tell them apart if you work through it in order:
- Check whether the low figure appears with a promotional label or a stated offer duration.
- Compare the low figure against the page’s observed base price range.
- See whether the price returned to its previous level after a short interval.
- Count how many times the same discount pattern has repeated on the card.
- Use the last-changed date to judge whether the current figure is a promotion or a settled base rate.
Paid base subscriptions run from $4.99 to $49.99, with most pages clustering between $5 and $10. Free pages set the price at $0 and earn through pay-per-view messages and tips instead. Promotional first months can sit below $4.99, for example a $3 first month, but a permanent base price under $4.99 is not something the platform supports.
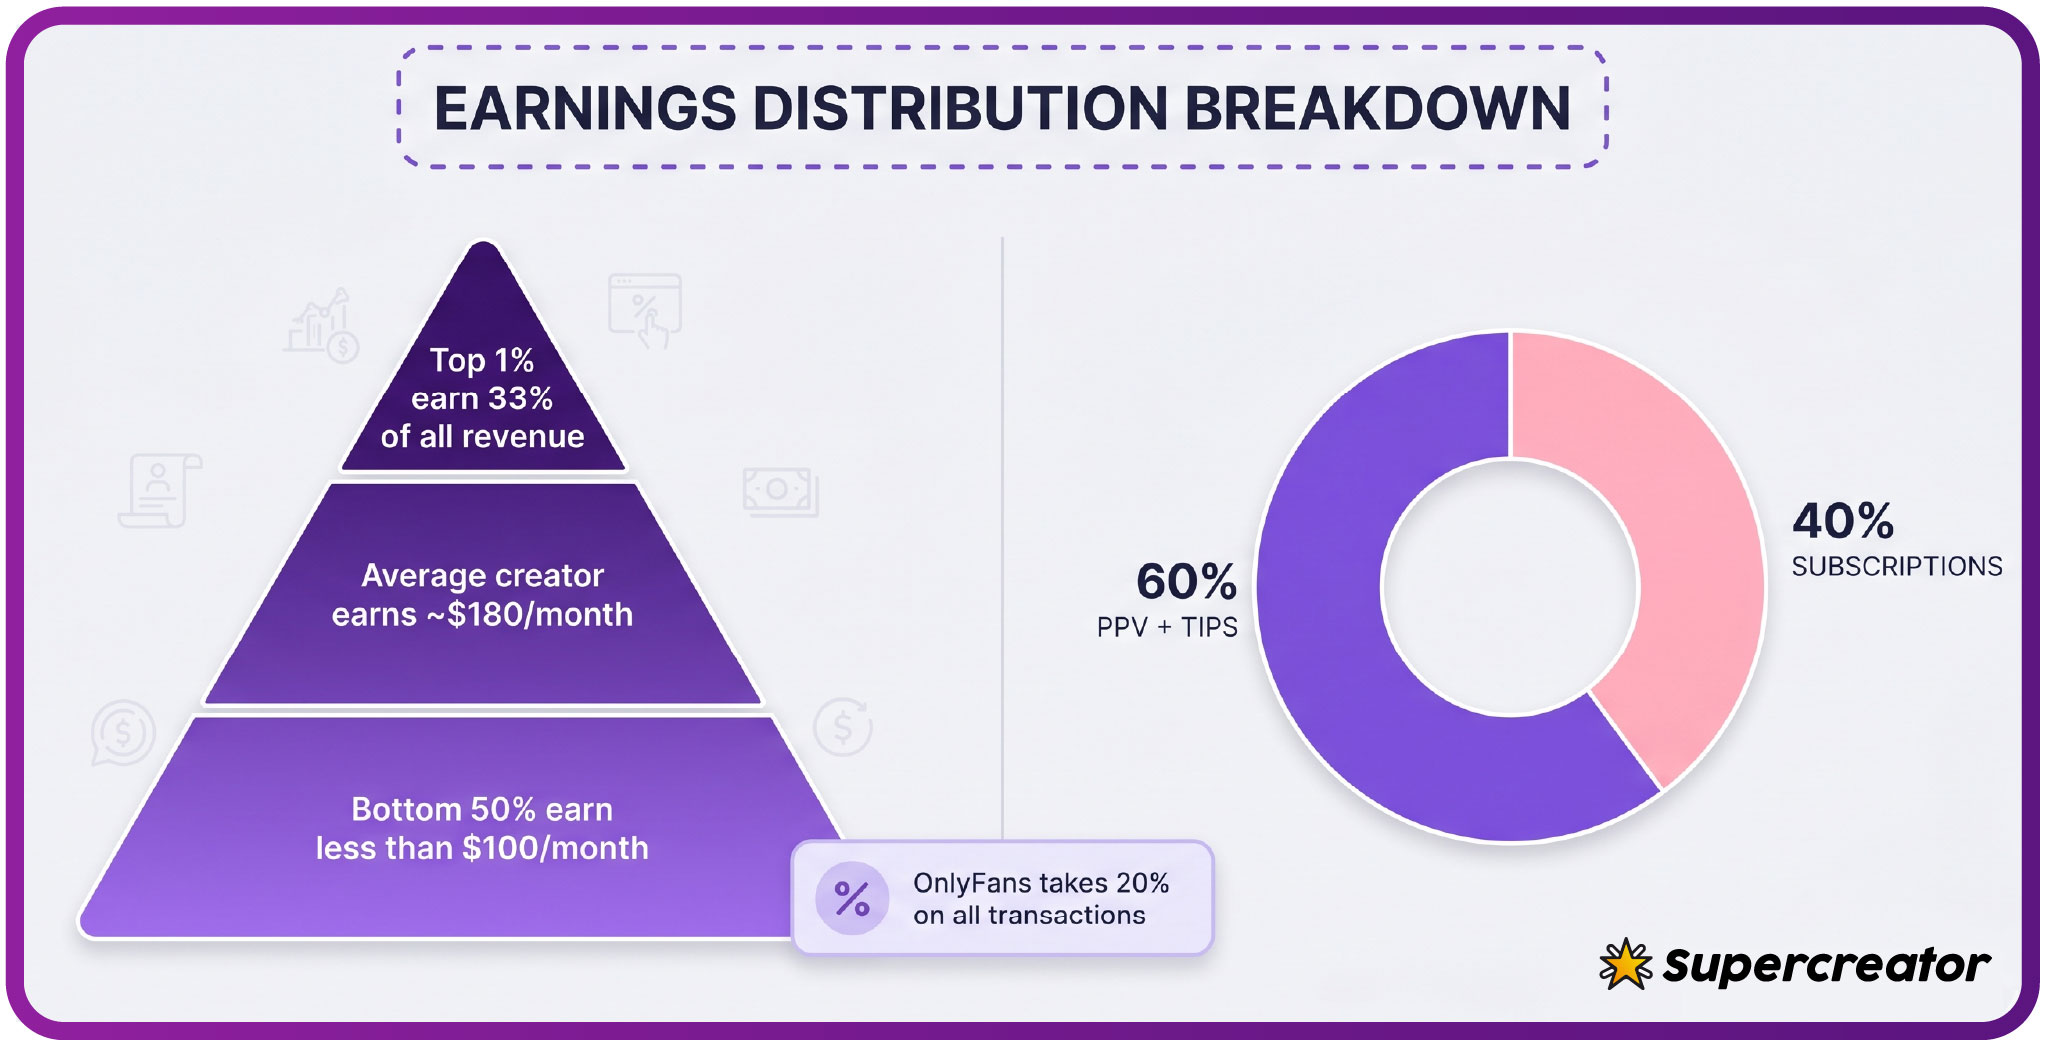
The revenue split behind the platform is fixed at 20% to the platform and 80% to the creator, so a creator’s incentive to adjust pricing reflects how their page is performing rather than any change in platform terms.
BestOnlyFans Price History Visualization Approach
The way a ranking platform draws price history determines what you can actually learn from it. BestOnlyFans presents temporal price data as a step chart rather than a smooth line, because subscription prices hold flat between changes.
Three edge cases matter in that visualization. Creator price experiments, where a page tests a new figure for a few weeks and reverts, appear as short steps and are labelled experimental rather than counted as full changes. Bundle introductions, such as a multi-month package, are recorded as separate products so they do not distort the base subscription series. Tier restructuring, where a page splits into two or three levels, resets the series with a clear marker instead of appearing as a sudden jump.
Predicting Future Price Changes From Historical Patterns
Pages that changed price three or more times in a year tend to change again, while pages that held one figure for two years mostly keep holding it. The correlation is strongest for pages in their first year, when creators are still testing positioning.
Four profile characteristics appear repeatedly alongside volatility:
- Recently launched pages still searching for a sustainable price point.
- Pages that restructured into multiple tiers within the past six months.
- Pages that repeatedly run promotional entry offers at different discount levels.
- Pages whose change history shows no stable period longer than 90 days.
Four signals point the other way, toward predictable pricing: a single base price held for more than twelve months, no promotional flag activity in the recent window, a stable tier structure with no additions or removals, and change entries spaced widely apart and small in size.
Seasonal experimentation is the main exception. Some pages test higher prices around periods of peak demand and revert afterwards, which inflates the change count without reflecting a long-term shift. Aggregators such as best onlyfans leaks sites sometimes surface pricing discussions alongside other page information, which can add context a chart alone does not show.
Using Stability Data to Time Subscription Starts
Timing is about avoiding a commitment that gets repriced a few weeks later.
| Volatility Signal | Recommended Action | Risk Level |
|---|---|---|
| Stable base price held 12+ months | Subscribe whenever convenient; renewals are predictable | Low |
| Single change more than 6 months ago | Subscribe normally, but treat the new figure as the baseline | Low to moderate |
| Frequent small adjustments | Start with one month only and reassess before renewing | Moderate |
| Major restructuring or tier reset | Wait one full cycle to see where the base price settles | High |
One month at a time is the practical rule for any page showing moderate or high volatility. The cost of a single month at the current price is small compared with the cost of an unplanned increase landing on a renewal you had already committed to mentally.
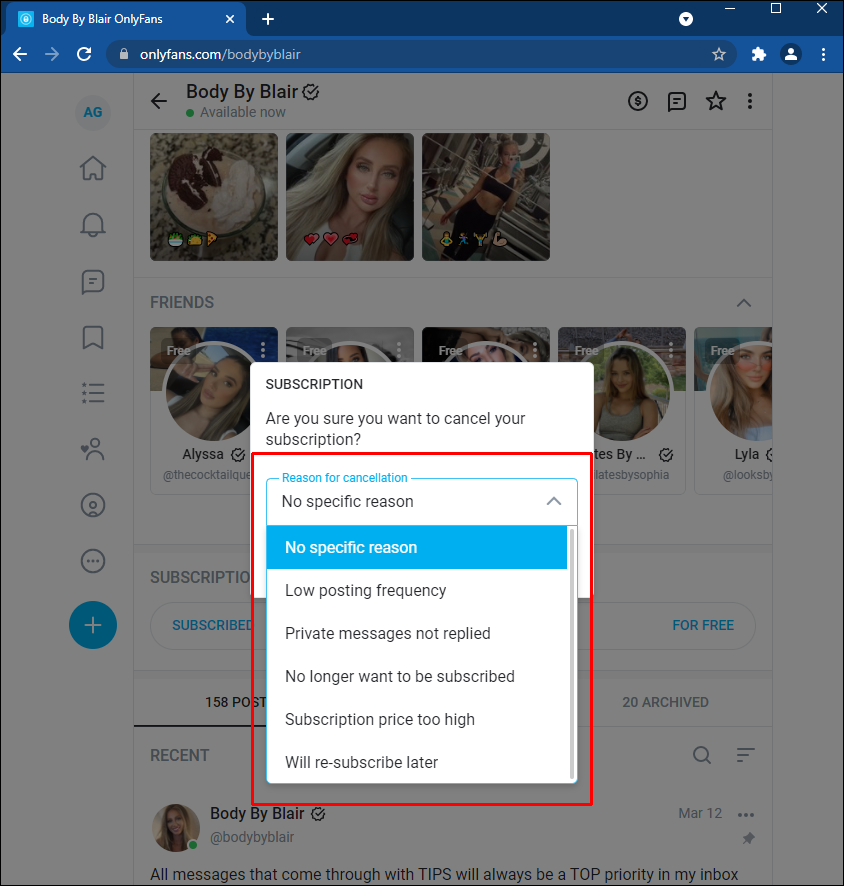
The cancellation flow reinforces the same point: ending a subscription is a deliberate step, so entering one is worth the same care.
Building a Low-Volatility OnlyFans Subscription Portfolio
If you subscribe to several pages, treat them as a portfolio rather than a list.
- Reserve roughly 60% of your monthly budget for pages with no changes in the past twelve months.
- Allocate about 25% to pages with a single change in the past year and a clear current baseline.
- Cap exploratory pages at around 10% and keep them on monthly terms only.
- Limit trial spending to about 5% for pages with frequent adjustments or active restructuring.
- Review the tier of every page quarterly using the last-changed date on its ranking card.
- Move any page that changes price twice in one quarter down one tier immediately.
- Keep a simple written record of every renewal amount so you notice drift before it compounds.
Remember that pay-per-view unlocks can reach $50, paid chat commonly runs $3 to $5 per message, and tips can go higher. Verification holds of $0.10 are separate from subscription pricing and are refunded within days, so they should not factor into stability scoring at all.

Account security completes the picture. Two-step authentication on your own account protects the payment methods tied to those subscriptions, which matters more once several renewals are running at once.
FAQ
How far back do ranking sites keep price history?
It varies by platform. Some keep a rolling twelve-month window, while others retain everything from the point they began tracking a page. Cards usually state the window they use, and the change count badge is only meaningful inside that stated period.
Can a creator change price without warning even with stable history?
A creator can adjust pricing at any time, and when a base price rises, auto-renew stops and access continues only until the current paid period ends.
Do promotional first months show as price changes in history?
On simpler trackers they may be merged into the same series, which inflates the volatility score for pages that routinely run introductory offers.
Why does one ranking site show more price changes than another for the same page?
Collection method and refresh frequency differ. A site polling daily catches short-lived changes that a crowdsourced tracker misses, and the reverse also happens.